Tagged Data

November Disability Employment Data
As the overall job market improves, more Americans with disabilities are finding employment for the second month in a row, according to today’s National Trends in Disability Employment – Monthly Update (nTIDE), issued by Kessler Foundation and University of New Hampshire’s Institute on Disability (UNH-IOD). Disability job training and employment initiatives continue to create and expand jobs for people with disabilities.
In the Bureau of Labor Statistics’ Jobs Report released Friday, December 5, the employment-to-population ratio increased from 26.5 percent in November 2013 to 26.9 percent in November 2014 (up 1.4 percent; 0.4 percentage points) for working-age people with disabilities. The employment-to-population ratio, a key indicator, reflects the percentage of people who are working relative to the total population (the number of people working divided by the number of people in the total population multiplied by 100).
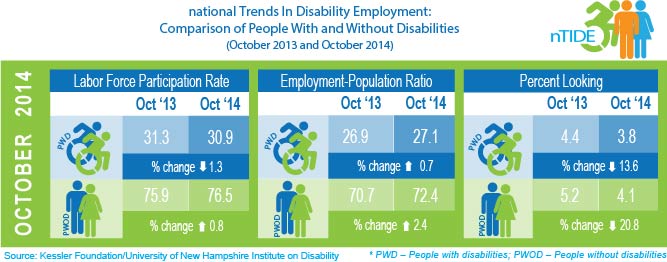
October Disability Employment Data
This morning the US Department of Labor released employment data for October, including data on the employment, unemployment, and labor-force participation of people with disabilities. For people with disabilities age 16 to 64, the data show a labor force participation rate of 30.9%, a slight decline from 31.3% in October 2013. Overall, 4.9 million people with disabilities participated in the labor force, compared to 4.8 million in October 2013.
According to the National Trends in Disability Employment report, the employment-to-population ratio increased from 26.9 percent in October 2013 to 27.1 percent in October 2014 (up 0.7 percent; 0.2 percentage points) for working-age people with disabilities. The employment-to-population ratio, a key indicator, reflects the percentage of people who are working relative to the total population (the number of people working divided by the number of people in the total population multiplied by 100).

Department of Labor Releases Economic Picture of the Disability Community Project
The U.S. Department of Labor has released the Economic Picture of the Disability Community Project, a joint initiative between DOL’s Office of Disability Employment Policy, Employment and Training Administration, Chief Economist, Office of the Secretary, and the White House Council of Economic Advisors (CEA). The data produced are based on CEA analysis of the Census Bureau’s 2010-2012 American Community Survey, matched to the Bureau of Labor Statistics’ 2012-2022 occupational projections. “Expect.Employ.Empower.with Data,” a blog authored by Heidi Shierholz, the Labor Department’s Chief Economist, and Kathy Martinez, Assistant Secretary of Labor for Disability Employment Policy, highlights some of the disability employment data and its significance for the U.S. workforce.
Federal Hiring of People with Disabilities Hits New High
Last year, the Office of Personnel Management announced that in Fiscal Year (FY) 2012, people with disabilities were hired at a higher percentage than at any point in the past 32 years. Additionally, people with targeted disabilities were hired at a higher percentage than at any time in the past 17 years. This success has also led to more people with disabilities serving in federal service than at any time in the past 32 years.
“People with disabilities are a vital part of the federal workforce, as we are better able to serve the American people because of the talents and experience they bring to the table.” said OPM Director Katherine Archuleta. “Since President Obama issued his Executive Order in 2010, we’ve made substantial progress in hiring and retaining people with disabilities over the past three years. This work is enabling the federal government to continue to develop as a model employer for people with disabilities.” Read more…
News like this is why the Six by 15 Campaign is seeking six governors or mayors to make disability hiring commitments like the President’s Executive Order. If you haven’t yet, join our effort by endorsing the campaign today!
Michigan DD Network and Lieutenant Governor Announce Employment Report
The Developmental Disabilities Network – Michigan Protection & Advocacy Service, Inc., the Developmental Disabilities Institute at Wayne State University, and the Developmental Disabilities Council – released their Employment First report at a press conference in September outlining the employment circumstances of Michiganders with disabilities, particularly those with intellectual and developmental disabilities. Michigan Lieutenant Governor Brian Calley, whose daughter has autism, spoke at the event, saying “We are not talking about charity here. We are talking about people that have something important and valuable and productive to add to our community and to our economy, to Michigan.”
The report finds that 60 percent of individuals with disabilities in Michigan want a job in their community, but only 17 percent of them have one. Most of those who are employed – over 8,000 Michigan citizens – are earning below minimum wage and making an average of $2.75 an hour.

The Michigan DD Network calls on the Michigan state legislature to enact Employment First legislation that recognizes and assumes that individuals with disabilities, with the proper supports and accommodations, can earn a fair and prevailing wage alongside individuals without disabilities in fully integrated settings.
Read more about the event and the report from the Lansing State Journal and Michigan Public Radio.
September Disability Employment Data
This morning the US Department of Labor released employment and unemployment figures for September, including data for people with disabilities. The data show – for people with disabilities age 16 to 64 – a labor force participation rate of 33.1% for men and 29.1% for women. This compares to rates of 82.4% for men and 70.1% for women of the same age group without disabilities. In total, these figures show that a total of 4.9 million working-age people with disabilities were participating in the labor force in September 2014. This is a decline from 5.1 million in September 2013. Stay tuned to the blog throughout this month for more stories about disability employment and how we can work together to push that number to 6 million by the end of 2015.
This infographic from the University of New Hampshire Institute on Disability shows the figures:


CDC Report: Millions of Childern Not Receiving Developmental Screening
This week’s Morbidity and Mortality Weekly Report published a supplement that examined the use of selected clinical preventive services among infants, children, and adolescents in the United States. This supplement indicates that millions of U.S. infants, children, and adolescents did not receive key clinical preventive services, such as screening for child development. In 2007, parents of almost eight in ten (79%) children aged 10–47 months were not asked by healthcare providers to complete a formal screen for developmental delays in the past year.
Increased use of clinical preventive services could improve the health of infants, children, and adolescents and promote healthy lifestyles that will enable them to achieve their full potential. Read the full Morbidity and Mortality Weekly Report article: Use of Selected Clinical Preventive Services to Improve Health of Infants, Children, and Adolescents – United States, 1999-2011
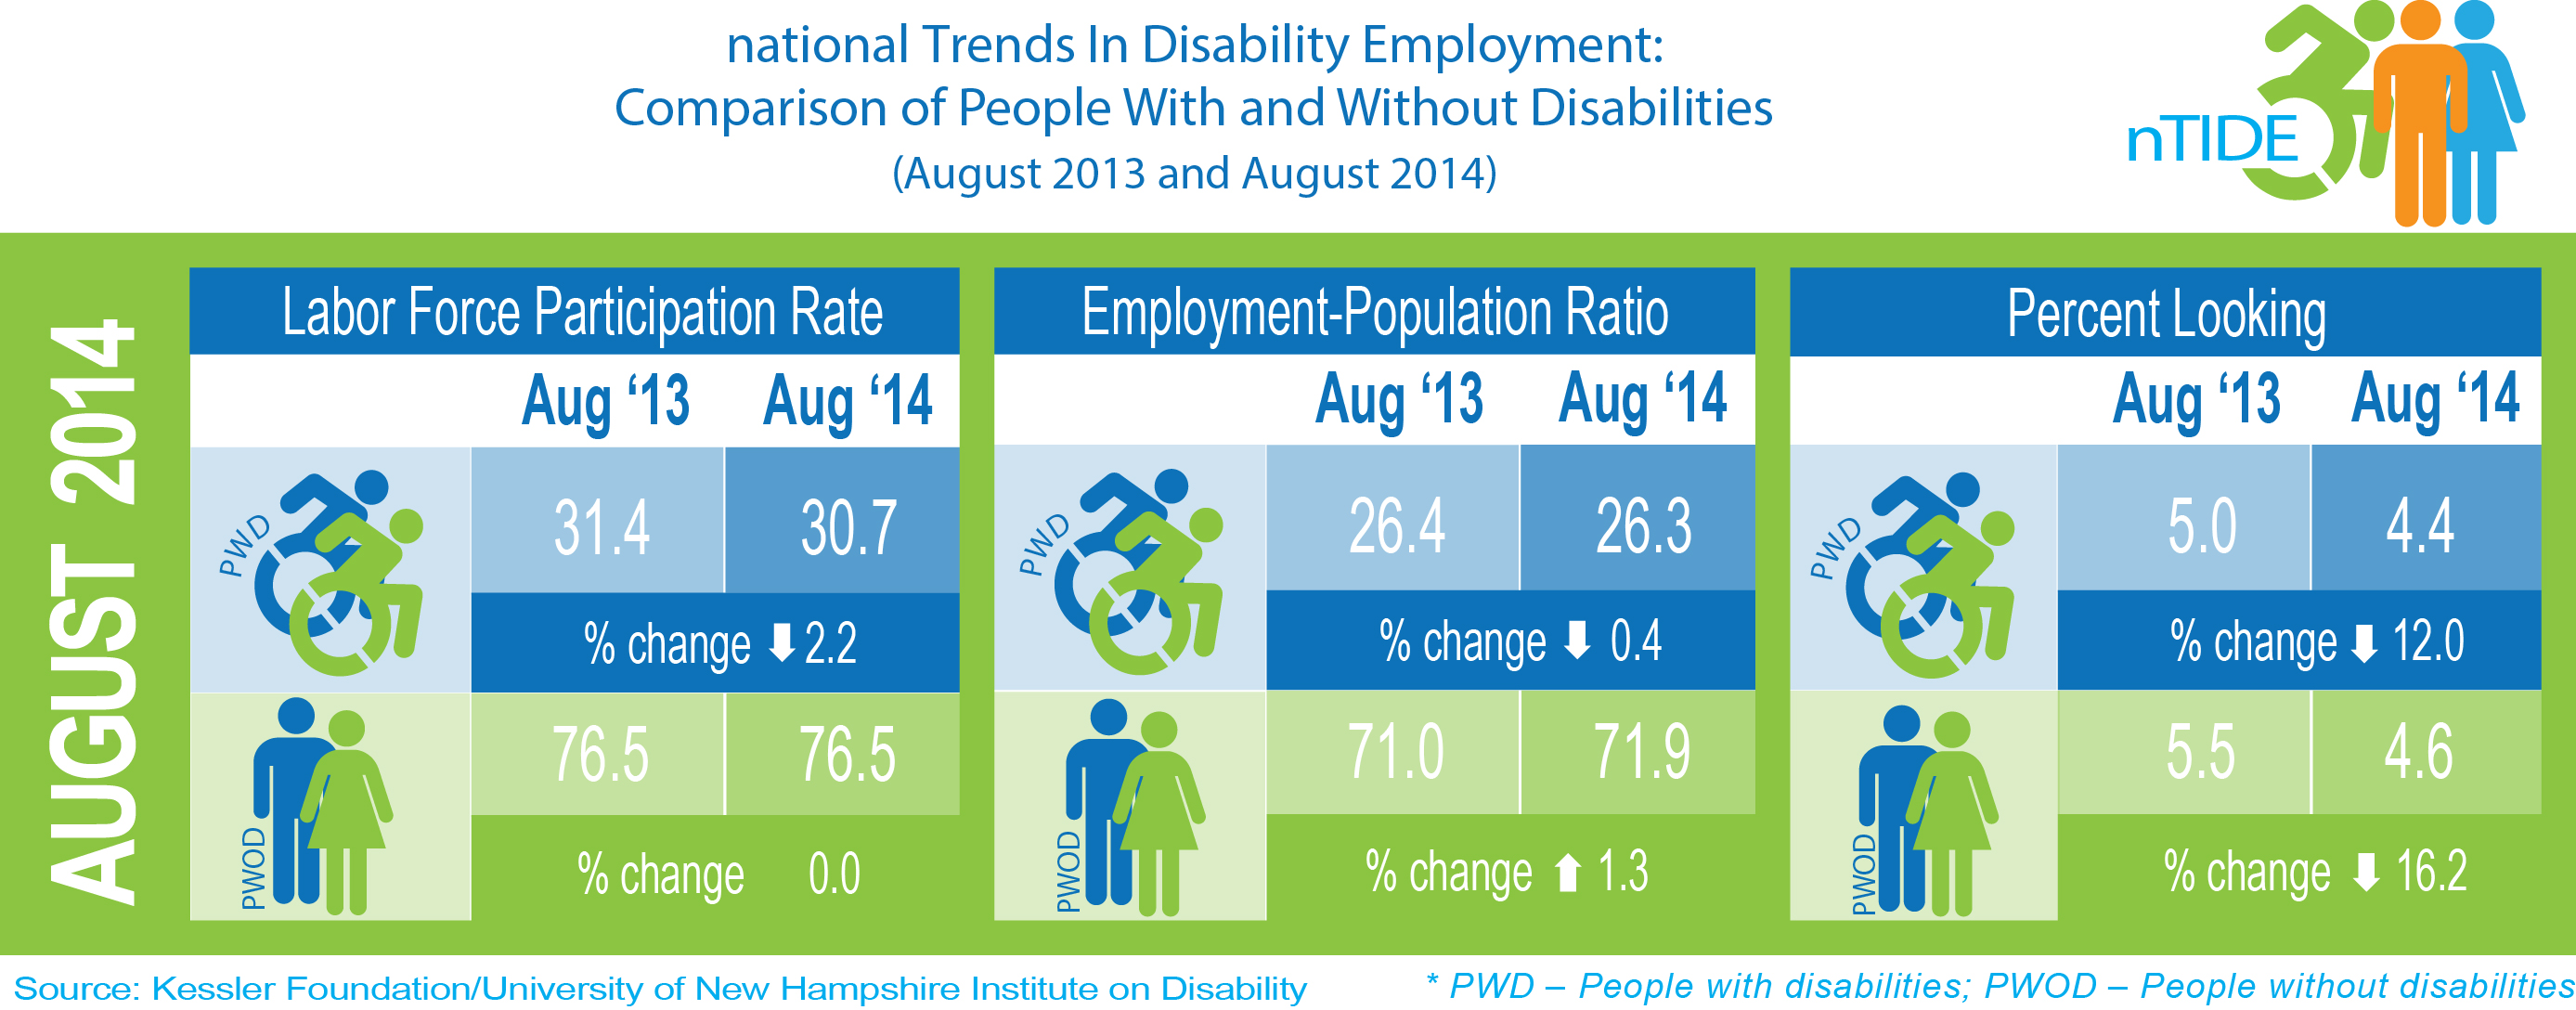
August Unemployment Data Released
On Friday, September 5, the US Bureau of Labor Statistics released its monthly jobs report. The report shows that the employment-to-population ratio decreased from 26.4 percent in August 2013 to 26.3 percent in August 2014 (down 0.4 percent; 0.1 percentage points) for working-age people with disabilities. The employment-to-population ratio, a key indicator, reflects the percentage of people who are working relative to the total population (the number of people working divided by the number of people in the total population multiplied by 100). For more information on these numbers and what they mean for people with disabilities, see the September nTIDE Jobs Report: People with Disabilities Falling Behind but Still Striving to Work from the Kessler Foundation and University of New Hampshire’s Institute on Disability.
June 2014 Disability Employment Data
The Bureau of Labor Statistics issued their monthly employment data release today. They found that in June of 2014, 4.597 million people with disabilities age 16-64 participated in the labor force, creating a labor-force participation rate of 32.7% for men and 27.0% for women. The labor-force participation rate for people without disabilities is 83.5% for men and 70.9% for women. Labor force participation means that someone is either working or looking for work. This non-seasonally adjusted number is lower than in June of 2013, in which 4.812 million people with disabilities participated in the labor force. To learn more about these statistics and employment for people with disabilities visit the Office of Disability Employment Policy. Read more on the Six by ’15 blog about how we’re working to get that number to 6 million by the end of 2015.
